6 Monitoring Tools
To help the programmer understand, tune, and debug distributed applications Mozart provides three tools for understanding the behavior of the DS.
For real-time monitoring of communication, there is a panel tool called Distribution Panel that displays the current activity of the running site.
To evaluate the result of a distributed application, the DS can be instrumented to write all events to a file. With help of a tool that displays logs graphically, logs from multiple sites can be displayed together in a graph.
To simulate the behavior of a distributed application there is a tool that can simulate a set of Mozart sites in a controlled environment. The simulator executes Mozart code and simulates distributed events by a discrete event simulation engine.
6.1 The Distribution Panel
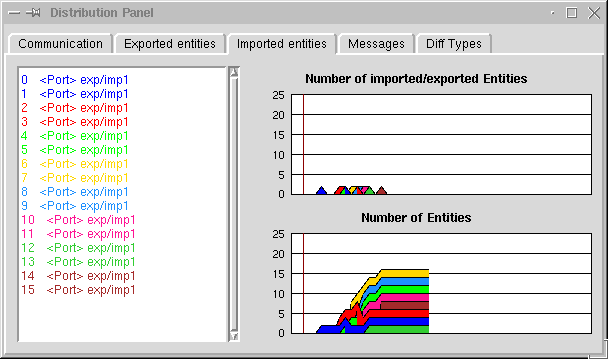
The Distribution Panel periodically retrieves the internal state of the Distribution Subsystem. The information is then displayed in a graphical tool (see Figure 6.1 and ``Distribution Panel''). The Distribution Panel enables monitoring the behavior of a Mozart site in runtime. Information of currently known remote sites, exported entities, imported entities, sent messages summarized by message type, and marshaling information is displayed.
6.2 The Oz Message Tracer
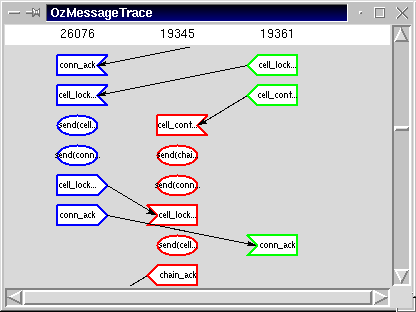
The tool merges logs from different Mozart engines doing distributed computation. The logs are sorted in the casual order imposed by their internal message sending and receiving, and displayed graphically (see Figure 6.2). From the visualization of the casual order of events in a distributed computation the behavior of a set of Mozart sites can be examined in detail. The OzMessageTracer is available via Mogul.
6.3 The Mozart Distribution-Subsystem Simulator
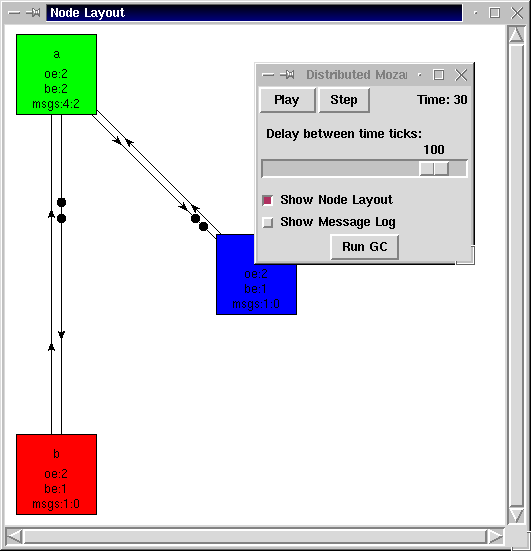
The simulator is a graphical tool (see Figure 6.3) for development and understanding of networked programming languages. It enables simulation of a set of communicating virtual machines in a controlled environment.
By giving the developer a tool where execution can be controlled, statistics can be retrieved and faults can be inserted, the simulator simplifies verification of new features for a networked programming language.


