2 Inspector Basics
This chapter provides some basic understanding about how the Inspector can be used.
2.1 Simple Invocation
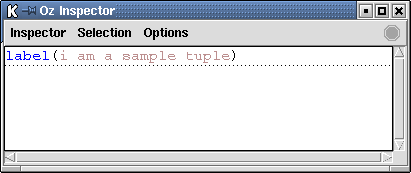
The simplest usage of the Inspector is to execute the statement {Inspect X}, where X can be any Oz value. Unless the Inspector window is already open, this will create a new window displaying the given value. For instance, the window in Figure 2.1 was created using the statement
{Inspect label(i am a sample tuple)}It is possible to inspect more than one value at the same time. By default, new values are appended to the current window.
2.2 Inspecting within Multiple Widgets
The Inspector can handle an arbitrarily number of viewing windows (called widgets) which can be accessed and configured independently.
2.2.1 Adding and Deleting Widgets
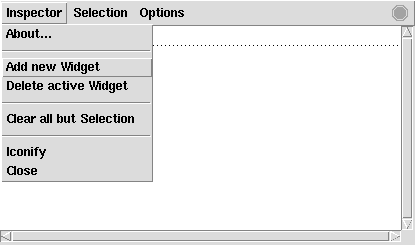
To open a new display widget, click ``Add new Widget'' from the Inspector menu as shown in Figure 2.2.
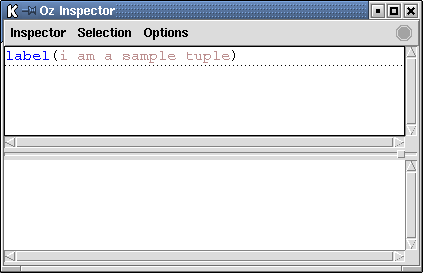
When more than one widget is used, the notion of the active widget becomes important. The active widget receives all work caused by applications of Inspect. By default, the initial widget is the active widget. This can be changed using the TAB key. The active widget is indicated by a box with extra-thick line width around its viewing area.
To show the value X in the I-th window, execute the statement {InspectN I X}. The widgets are numbered starting from zero.
The currently active widget can be removed by clicking ``Delete active Widget'' from the Inspector menu (see Figure 2.2). The widget below the active widget becomes the new active widget. If only a single widget is left, this action is ignored.
2.3 Value Representation
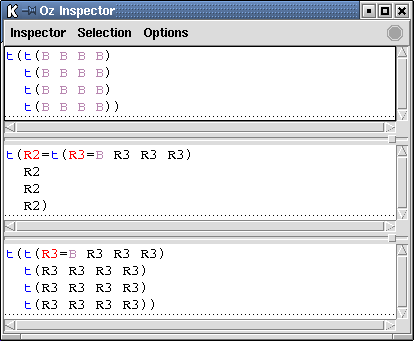
The Inspector can be configured to display values using either a tree-like or graph-like representation (see Figure 2.3).
Tree
The value will be shown as a tree with respect to given depth and width exploration limits. Values larger than the given limits are truncated, the cut positions being indicated by down and right arrows, respectively.
Graph
The value will be shown not only with respect to given depth and width exploration limits but also with respect to an equivalence relation: Repeatedly occurring sub-values will only be displayed once, all later occurrences being replaced by references to the first occurrence. This yields a more compact representation revealing more information about the value's structure. Equivalence is computed in a depth-first left-to-right traversal over the entire (truncated) value.


