Top
The Mozart Profiler
This manual describes the profiler for the Mozart programming system. With its help you can optimize your Oz applications. It mainly counts procedure applications and measures their memory consumption, presenting its calculations using nice, clickable bar charts.
Once your application works, you may wish to optimize it for speed and memory consumption. For this, you need to identify the parts of your application that may significantly benefit from such optimizations; it would be pointless to optimize a procedure that is called only once. Profiling automatically instruments your program to gather statistical data on procedure invocations and memory allocation.
The profiler collects information in a per procedure basis. This information consists of the following quantities:
- heap
Heap memory allocated by the procedure
- calls
How many times the procedure was called
- samples
Statistical estimation of the time spent in the procedure. This works as follows: every 10ms a signal is delivered and the emulator increases the ``samples'' counter of the procedure currently executing.

This is broken and disabled in the current implementation!
- closures
How many times the corresponding closure was created. Note that nested procedure declarations like Bar in
proc {Foo X Y}
  proc {Bar U V} ... end
  ...
end
both consume runtime and memory since a new closure for Bar has to be created at runtime whenever Foo ist called. So one might consider lifting the definition of Bar.
In order to gather the profiling information, your code has to be instrumented with additional profiling code. This code is automatically inserted by the compiler when it is invoked with the --profiler option. This option can also be abbreviated -p. There is however an unfortunate limitation when compiling code for profiling: tail-call optimization is turned off (except for self applications). Besides this instrumented code runs in general a bit slower than code that was not compiled for profiling.
As an example, let's consider the following rather pointless application below. I call it ``The 3 Little Piggies'', and it does nothing but waste time and memory:
functor
import Application
define
   Args = {Application.getCmdArgs
           record(size( single type:int optional:false)
                  times(single type:int optional:false))}
   proc {FirstPiggy}
      {List.make Args.size _}
      {For 1 Args.times 1 SecondPiggy}
   end
   proc {SecondPiggy _}
      {List.make Args.size _}
      {For 1 Args.times 1 ThirdPiggy}
   end
   proc {ThirdPiggy _}
      {List.make Args.size _}
   end
   {FirstPiggy}
   {Application.exit 0}
end
The application can be compiled for profiling as follows:
ozc -px piggies.oz -o piggies.exe
The profiler interface is integrated in the Oz debugger tool ozd and can be invoked using the -p option. We can profile ``The 3 Little Piggies'' as follows:
ozd -p piggies.exe -- --size 1000 --times 100
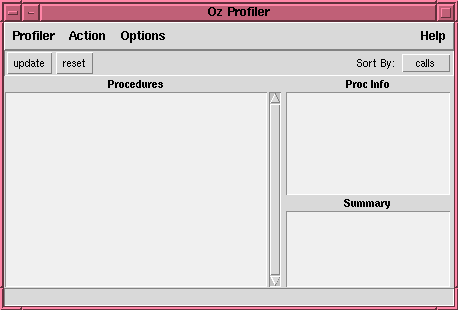
Note how the double dash separates ozd's arguments from the application's arguments. Shortly thereafter, the window shown below pops up:
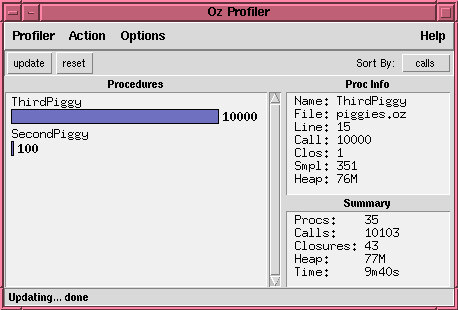
Now click Update and a summary of procedure calls is displayed. We learn that the SecondPiggy is called 100 times and the ThirdPiggy 10000 times (i. e. 100*100).
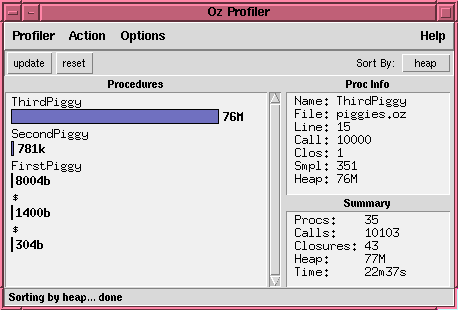
The FirstPiggy is not shown by default because it is called only once. Let's now select a different Sort By (the menu button on the right): we choose heap to display the memory allocation profile. From this we verify e. g. that ThirdPiggy allocates about 100 times more memory as SecondPiggy, which is as it should be since it is called 100 times more and allocates the same large list.
If you have created an Oz application which you normally start from the shell as follows:
Foo Args ...
Then you can run it under control of the Oz profiler by using the following command instead:
ozd -p Foo -- Args ...
Any Oz application can be run in the profiler, but you only get the full benefit of the profiling interface when the code being executed was compiled with the -p option to include profiling instrumentation code. The profiler and the debugger share the same interface.
The double dash -- separates the arguments intended for ozd from those intended for the application being run under the profiler.
--help, -h, -?Display information on legal options, then exit
-p, --profiler, --mode=profilerYou must supply this option in order to start the profiler; otherwise the debugger is started instead (see Chapter 4 of ``Oz Shell Utilities'').
-g, --debugger, --mode=debuggerThis is the default option: it starts the debugger (see Chapter 4 of ``Oz Shell Utilities''). As mentioned above, in order to actually start the profiler, you must supply the -p option.
-E, --(no)useemacsStarts a subordinate Emacs process. This will be used to display the source code corresponding to the profile data being examined.
--emacs=FILESpecifies the Emacs binary to run for option -E. The default is $OZEMACS if set, else emacs.
If a procedure Foo, that has been compiled for profiling, calls another procedure Bar, that was not compiled for profiling, only the counters for Foo are incremented at runtime. So for example the heap memory allocated within Bar is added to the heap profile counter of Foo. For efficiency all the Oz library modules are compiled without profiling information. So if Foo itself does not much more than calling List.append it might show up high in the profilers window, if it is often called with very long lists for example, whereas List.append will not show up at all. Nevertheless you might in this case consider changing the representation of your data structures.
In the OPI the most convenient way to start the profiler is to choose the Profiler item in the Oz menu of Emacs. This will open the profiler window and tell the compiler to instrument the code for profiling thereafter. So everything fed after opening the profiler will be instrumented. Then press reset, run your application and press the update button after its termination.
Clicking on the bar of a particular procedure P in the profiler's window will try to locate the definition of P in an Emacs buffer.
Profiling is switched off in the OPI by either closing the profiler window or by feeding
{Profiler.close}
which will close the profiler window and inform the compiler to generate uninstrumented code thereafter. Note that code previously compiled for profiling will still run slower, so you might consider recompilation.
The profiler window consists of the following frames:
ProceduresPresents a list of bars for each procedure sorted by the sort criteria selected via the Sort By menu. Clicking on a bar will update the Proc Info frame and will additionally try to locate the definition of the corresponding procedure in an Emacs buffer.
Proc InfoLists for the selected procedure its name, the file name and line number of the source code of its definition plus the values of all the profile counters.
SummaryLists the sum of all the counters of all procedures being compiled for profiling.
The profiler provides the following buttons and menus:
ActionUpdateRead the current values of the profile counters from the emulator and update the display in the Procedures frame.
ResetResets all profile counters to zero.
OptionsUse EmacsThis is a toggle button that lets you choose whether clicking on a bar in the Procedures frame will tell Emacs to locate the definition of the selected procedure.
Automatic UpdateLets the user select an interval in which the displays are updated periodically. By default automatic update is off.
updateSame as menu Action --> Update.
resetSame as menu Action --> Reset.
Sort BySelects the sort criteria by which procedures are listed in the Procedures frame.
- environment variable
OZEMACS: 4 Command Line Options
OZEMACS environment variable: 4 Command Line Options
Denys Duchier, Benjamin Lorenz and Ralf Scheidhauer
Version 1.4.0 (20080702)


